What is a word cloud?
Word Clouds are a visualization method that displays how frequently words appear in a given data source by making the size of each word proportional to the number of times the word occurs in the dataset. When the data is text-based in data science, Word Clouds is one of the best ways to understand the recurrence of words at a glance. Typically, Word Clouds depict keywords in the text in the form of a cluster-type image, as seen below:
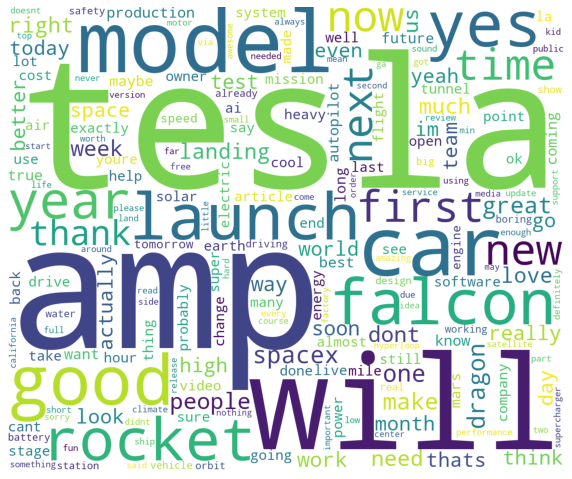
Predictably, words like tesla, car, falcon, model, etc., used heavily in the data source, have larger sizes than other words.
Creating a Word Cloud in Python
You need to install and import Pandas, Matplotlib, and WordCloud libraries to create a word cloud in python. You can use the default stopwords in the Wordcloud library, or you can also try to create and import your stopwords like this and use it.
The clean() method is specific to this dataset. You can modify it according to the needs of your dataset. We clean the dataset so that there are no unwanted characters and strings in the output. Here, tweets are the data source. Therefore we use the tweet-preprocessor library and few other techniques to clean it.
import re
import pandas as pd
import matplotlib.pyplot as plt
from wordcloud import WordCloud, STOPWORDS
import preprocessor as p
p.set_options(p.OPT.URL, p.OPT.EMOJI, p.OPT.RESERVED, p.OPT.MENTION, p.OPT.NUMBER, p.OPT.URL, p.OPT.SMILEY, p.OPT.EMOJI, p.OPT.ESCAPE_CHAR)

# Removes special characters and word from data source, can be modified as per requirement
# Here we clean our dataset to remove special characters generally used in tweets
def clean(text):
  text = text.apply(lambda x: p.clean(x))
  text = text.apply(lambda x: re.sub('^[b\'b\"]', '', x.lower()))
  text = text.apply(lambda x: re.sub('[\'!@#$:.;,?&"]', '', x.lower()))
  text = text.apply(lambda x: re.sub('  ', ' ', x))
  text = text.apply(lambda x: re.sub('^rt', '', x))
  text = text.map(lambda x: re.sub("\(http://.*?\s\(http://.*\)",'',str(x)))
  return text

# Replace path-to-dataset with the complete path and filename of the csv file
sample_data = pd.read_csv("path-to-the-dataset", encoding= 'unicode_escape')

# Clean sample data
sample_data["text"] = clean(sample_data["text"])

# Join all to create string of tokens
all_text = ' '.join(sample_data['text'].str.lower())

# Create wordcloud using https://pypi.org/project/wordcloud/ library
wordcloud = WordCloud(stopwords=STOPWORDS, background_color="white",collocations=False,
                      width=1200, height=1000).generate(all_text)

# Display data as an image
plt.imshow(wordcloud)

# Disable x and y axis annotations
plt.axis("off")

# Display figure on screen
plt.show()